I spent some time this spring (and some of the summer) analyzing and attempting to predict bike sharing system demand. This was motivated by situations here in Boston when I’ve been frustrated by either stations lacking docks or stations lacking bikes. These situations seemed to happen at rather predictable times, so I decided to take a look and see just how predictable it was! I had some success, and I’ll be (hopefully) documenting my progress as I seek to improve it. In the meantime, here’s what I’ve come up with so far.
I decided to start with New York’s CitiBike system, given that there’s a bunch more data there, and they have reasonably up-to-date historical ride-sharing data (unlike Boston, which only has data for 2011-2013).
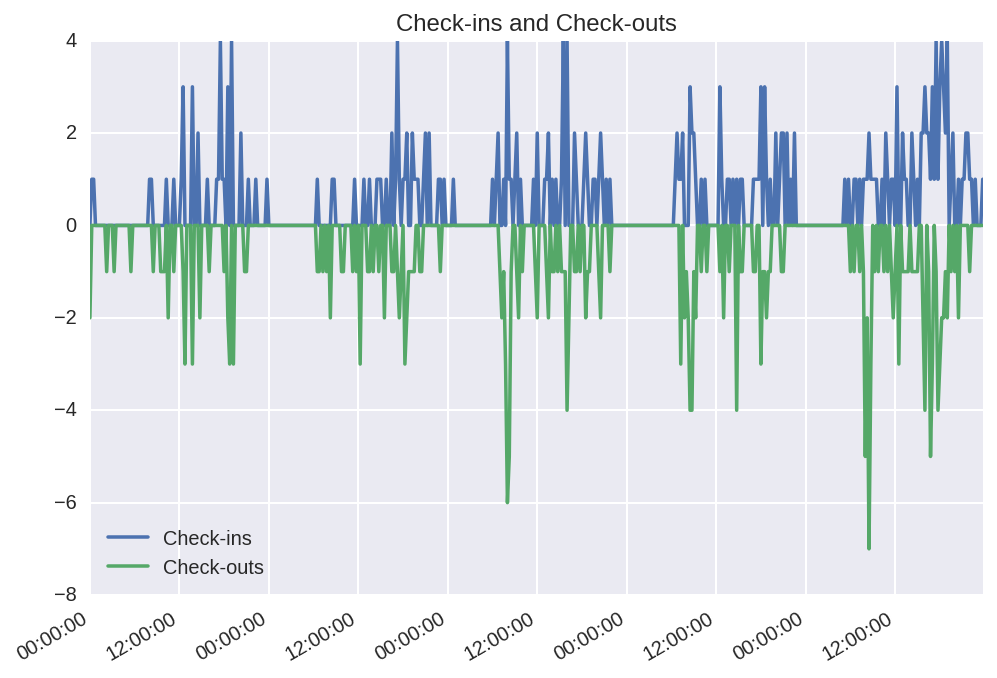
The data was in the form of rows of individual rides; I chunked these up into checkouts/checkins per station/10 minutes; here’s an example for a single station.
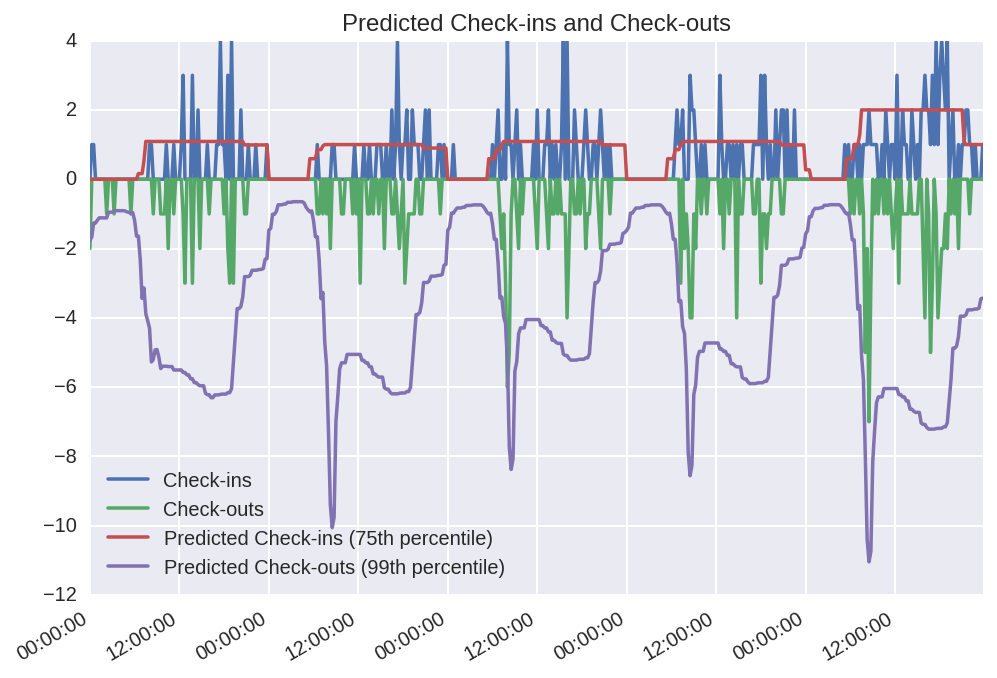
For various reasons; partly due to the unexpected difficulty of predicting the peaks and partly due to space considerations, I decided to use gradient boosting trees with a quantile loss function to try to predict these values. I don’t want to go into details, but these produce reasonably simple models that can predict ‘worst-case’ (99th percentile) and ‘medium-case’ (75th percentile) values. It does… OK predicting future data (which is the case here; the actual values are from April 2016 while the models were fit from data through March).
Then, you could produce a ‘worst-case’ scenario for how many net bikes will be checked out by subtracting medium-case checkins/minute from worst-case checkouts/minute. Then multiply (integrate, really) this value by how much time you want to predict into the future and subtract that resulting value from the current amount of bikes to predict how many bikes will be available. The reverse process will predict the total amount of docks.
I’ve implemented this into an app online, which will tell you which nearby stations are likely to have bikes in the near future and which ones won’t.
[NOTE: as of this posting, these maps might not work on your browser. Chrome is likely your best bet.]
As a sanity check, I’ve simulated checkouts for this coming Monday (August 8th, 2016) with a temp of 30 degrees C.
There are obvious peaks in activity around 9 AM and 5 PM (9:00 and 17:00). Geographically, it mostly makes sense–you can see more activity in the morning in residential areas (Upper East and Upper West Sides as well as Brooklyn) and around the principle points of entry for commuters (Penn Station, the Port Authority bus terminal, and Grand Central). Commercial districts like Wall Street, meanwhile, have more activity in the evening rush.
Fast forwarding to January 5, 2017, which I’m predicting will have a temperature of 0 C.
We see a pretty good drop-off in checkouts, although it may be a bit too big of a peak for rush hour. So, this works OK for right now, but I’ll need to explore other options if I want to predict checkins and outs better, as well as work with systems like Boston’s that don’t release data too often.